Timing Information Control
Description
Inserts a debug control that displays timing metrics for UX rendering, including specific query durations for List controls.
The Timing Information control helps developers analyze performance by displaying the duration of various tasks performed when the UX Component is rendered.
It is particularly useful for identifying performance bottlenecks in complex components.
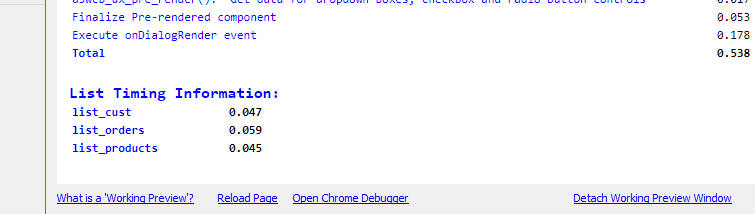
List Query Timing
The control displays specific information regarding List controls within the UX. It reports exactly how long the query (to populate each List) took to execute.
This metric allows you to determine if slow load times are caused by the database query itself or by the rendering of the control on the client.
Adding the Timing Information Control
In the UX Builder, click the Add Control button.
Type "time" in the filter box to locate the control.
Select the Timing Information control from the list (typically located under the Defined Controls section).
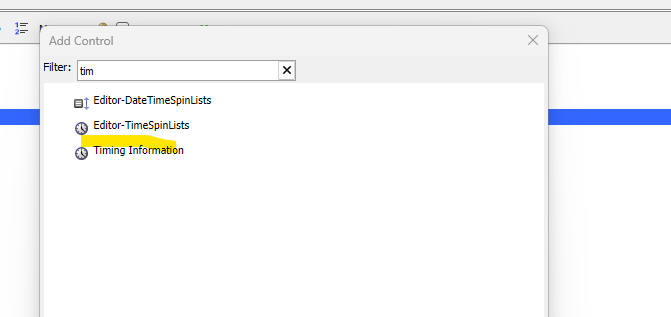 Selecting the Control
See Also